 |

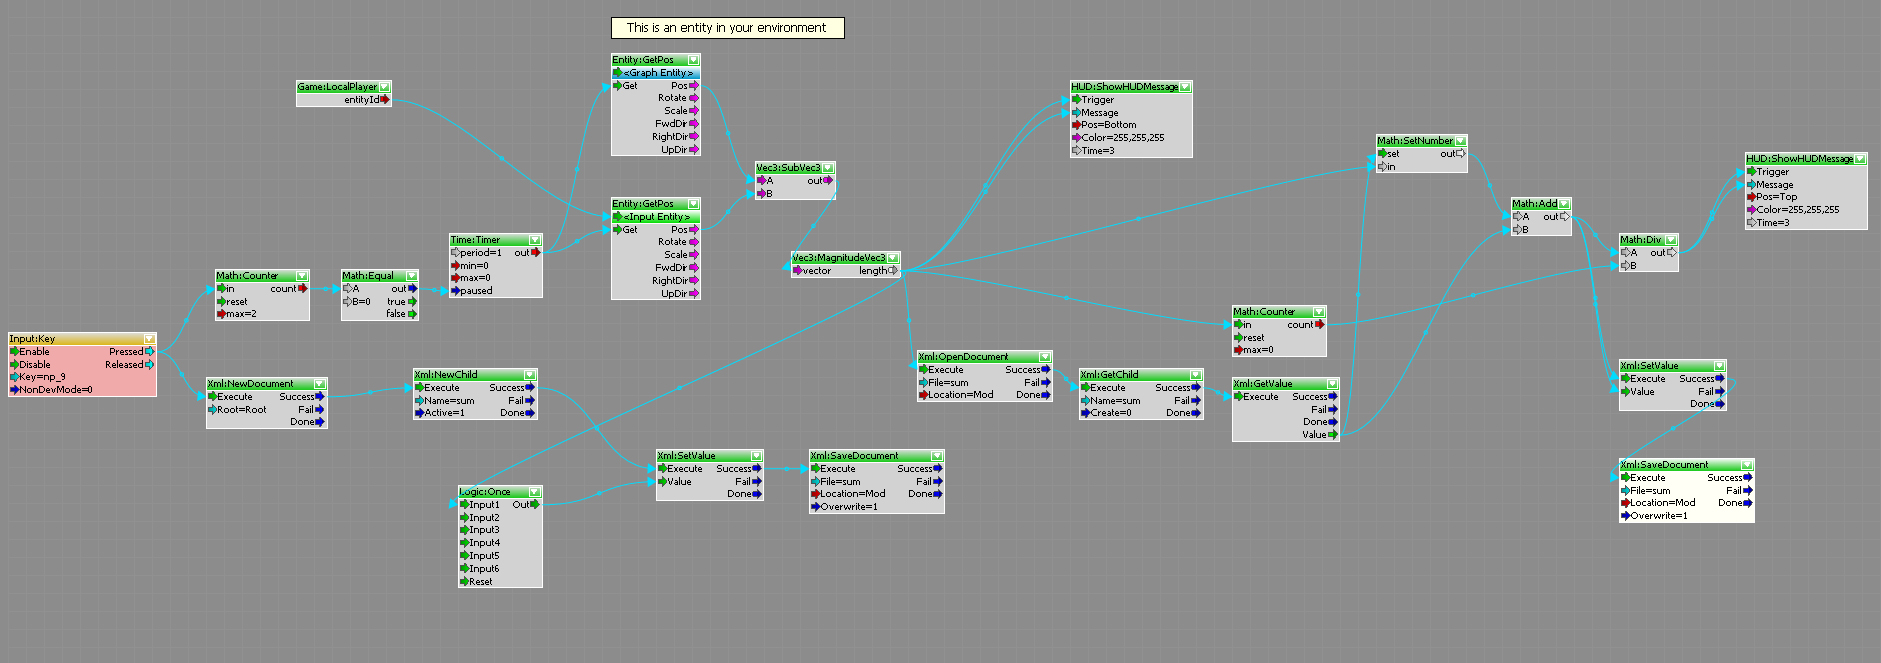
1. In your current Experiment 2 environment implement the flow graph shown in the image below.

2. Create a blog post that shows a video of the flowgraph in action. Also, post a series of images showing your version of the flowgraph above that includes comments describing what it does and how it works. As the flowgraph is large you'll need to zoom in on parts of it so that we can read your comments (to add a comment right click in the grey area and select "Add Comment").
3. Create a blog post that provides links to the websites/webpages/wiki's/forums/etc where you've found useful information on potential of using flowgraph for analysis ... add a short note under each link with a description of what you've found. Call this blog post "Research" ... and keep adding to it as you find more valuable info over the rest of the course.

Complete by the beginning of the next tutorial.
1. Create a blog post proposing how you might use the technique demonstrated in the flowgraph above to analyse information from your chosen Pachube feed.
2. With the combined potential of the flowgraphs you've developed and the one above in mind write a 250 word (maximum) brief for your Analytics Engine. Also keep in mind that the assessment criteria states that the brief should grow clearly from your research into and S.W.O.T analysis of your chosen Pachube feed.
Note: Flowgraphs don't exist in a vacuum; depending on the students concept they will need to link/embed flowgraphs in objects, spaces, vehicles, players that in some cases will need to be custom designed and built in SketchUp.
3. Keep adding to your Research post as you find more valuable info during the rest of the course. This will help you immeasurably with your Research assignment.